


Part One: Product Temperature
Introduction
Through various experiments and field tests we have demonstrated the performance of BlueSeal air curtains across various scenarios for product conservation and reducing energy use in transport refrigeration.
In this simulation experiment we are examining the effectiveness of BlueSeal where goods will be exposed to varying levels of outside temperature when different combinations of rear doors are opened. For three examples we are considering situations where goods will be loaded/unloaded from vehicles in a 7.5 metre truck to test how BlueSeal’s performance differs in a real-world scenario.
The reason for this is that often during distribution, drivers will only open the necessary doors that they require to load/unload and this will affect the effectiveness of BlueSeal air curtains towards preserving product integrity. By understanding the relationship between door openings and product conservation we can further understand how to ensure the best real-world application of BlueSeal air curtains to keep your products fresh for more stops during delivery runs.
The three common instances of door openings that we are exploring in this test are:
- both doors opened in a rear 2 door truck (full opening)
- one door is opened in a rear 2 door truck (half opening)
- one door is opened in a rear 3 door truck (one-third opening)
For the purposes of this test we will be using ice cream as our test product. This is because ice-cream is a notoriously challenging product to transport that becomes easily spoiled by temperature fluctuation. The product becomes less than desirable upon melting and re-freezing leading to an icy and grainy texture.
To gauge the capability of BlueSeal to keep the product at a constant temperature, we are calculating the vehicle’s inside air temperature and the product itself based upon a theoretical model. ATP guidelines for deep frozen foodstuffs and ice products recommend critical temperatures of -18°C and -20°C (src: ATP Handbook 2016, annex 2). In this study we have chosen to explore whether products in a truck can be kept to below -18°C during transportation and are using a 6kW cooling power unit. In one of our next papers we will focus on energy usage using different powered cooling machines.
Study design
For this experiment we used a theoretical model (Brightec 2019) to simulate the temperature-time course during a 6 hour distribution drive. We determined that 36 x 10 minute cycles with the doors closed for 8 minutes and opened for 2 minutes per cycle would be accurate to a real-world application.
In this model the variation in temperature is calculated in two kinds of ice cream configurations transported in the same truck:
1. Bulk packaged ice cream: the calculation is focussed on the outer layer of the bulk-packed ice cream placed on pallets with a depth of 6m in the cargo space of a truck. Pallet height is 1.2m (h) x 2.5m (w). Bulk packaged temperature is described as “Tbulk”.
2. Single 0.5kg packages of ice cream: placed individually and fully exposed to the inside air in the cargo space. Individual packages are kept separate from each other. Individually packaged ice cream temperature is described as “Tpackage”.
Single packages of ice cream present a worst-case scenario from increased exposure to the cargo air. We are informed that this configuration is common in ice cream distribution and forms a situation at greatest risk to the cold chain and preservation of the product during door openings.
In our simulation, a set point of -25°C is used in the cargo space and an ambient temperature of 35°C. The cooling machine switches off at an inside air temperature of -30°C.
The simulation model has been validated with temperature measurements in ice cream packages (from -30°C to -5°C) exposed to air at room temperature. This model is able to cope with different door opening scenarios at different outdoor temperatures, cargo contents and inside temperature set points.
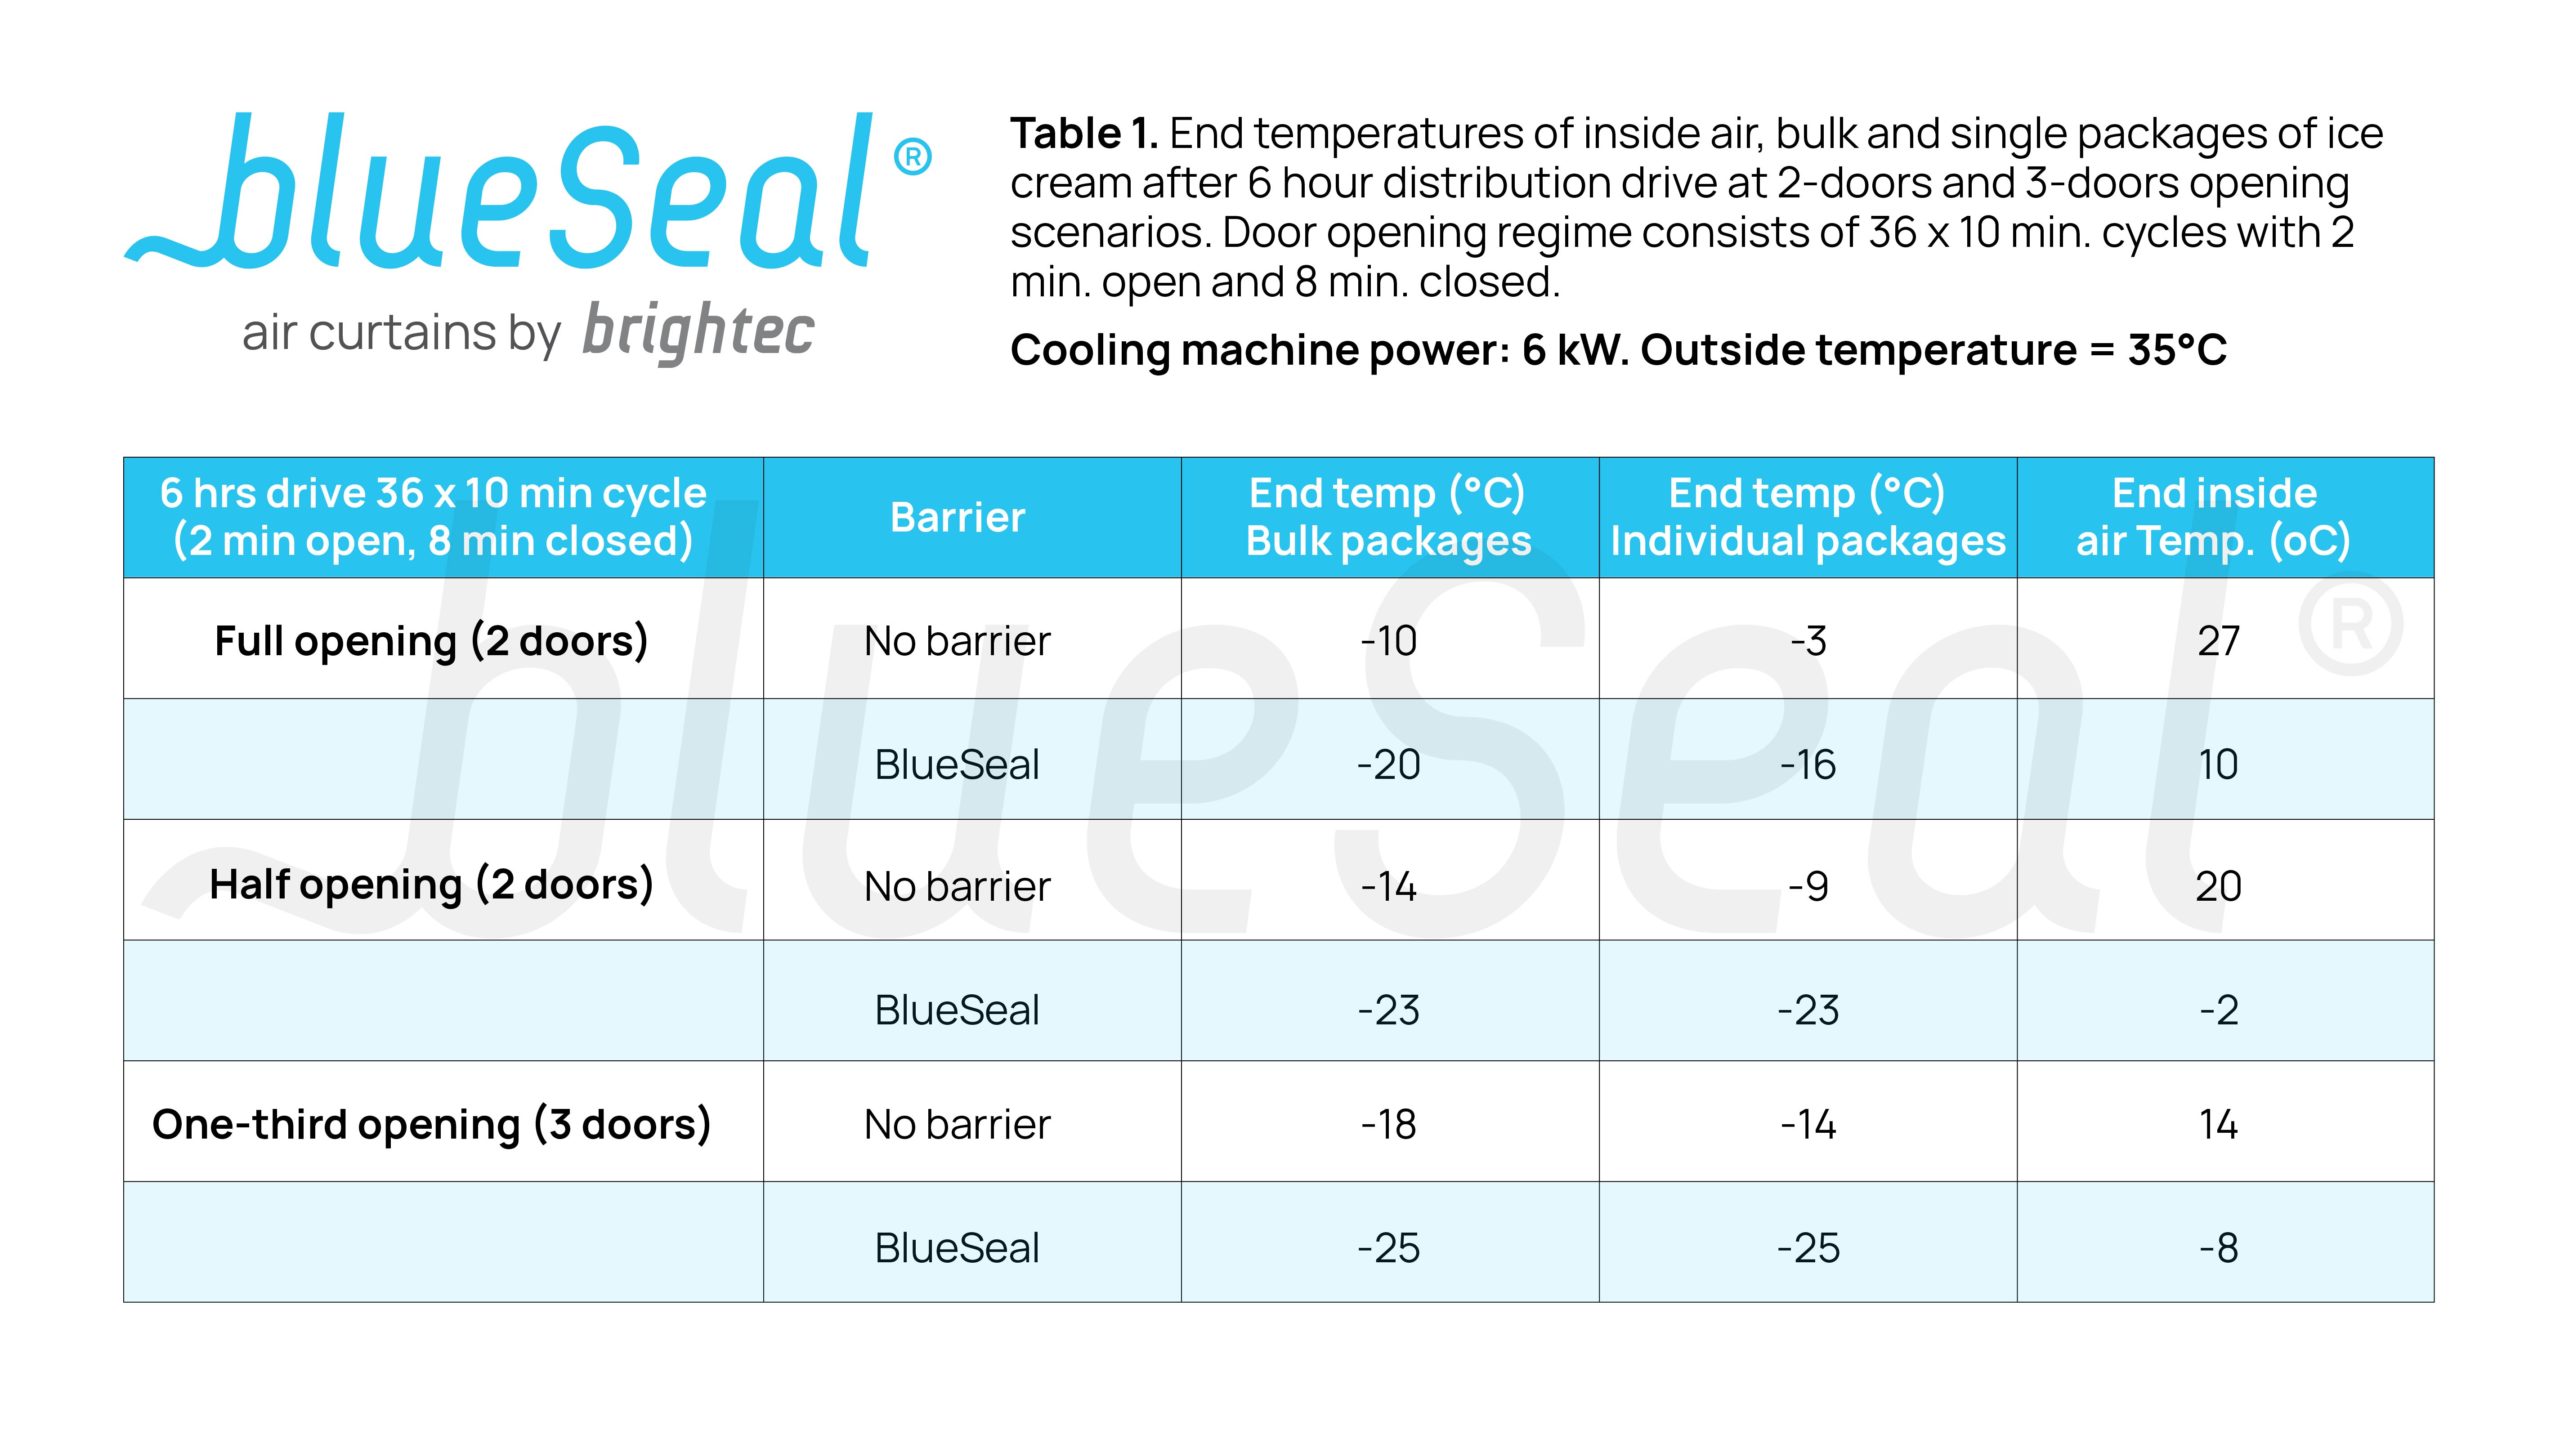
Temperature courses will be shown in figures for the first 2 hours (with 12 x 2 minute door openings) and the latter temperatures after 6 hours (I.e.- 36 x 2 minute door openings) will be shown in a table to give a clearer illustration of the temperature courses throughout the day.
Results
Full (2-door) opening
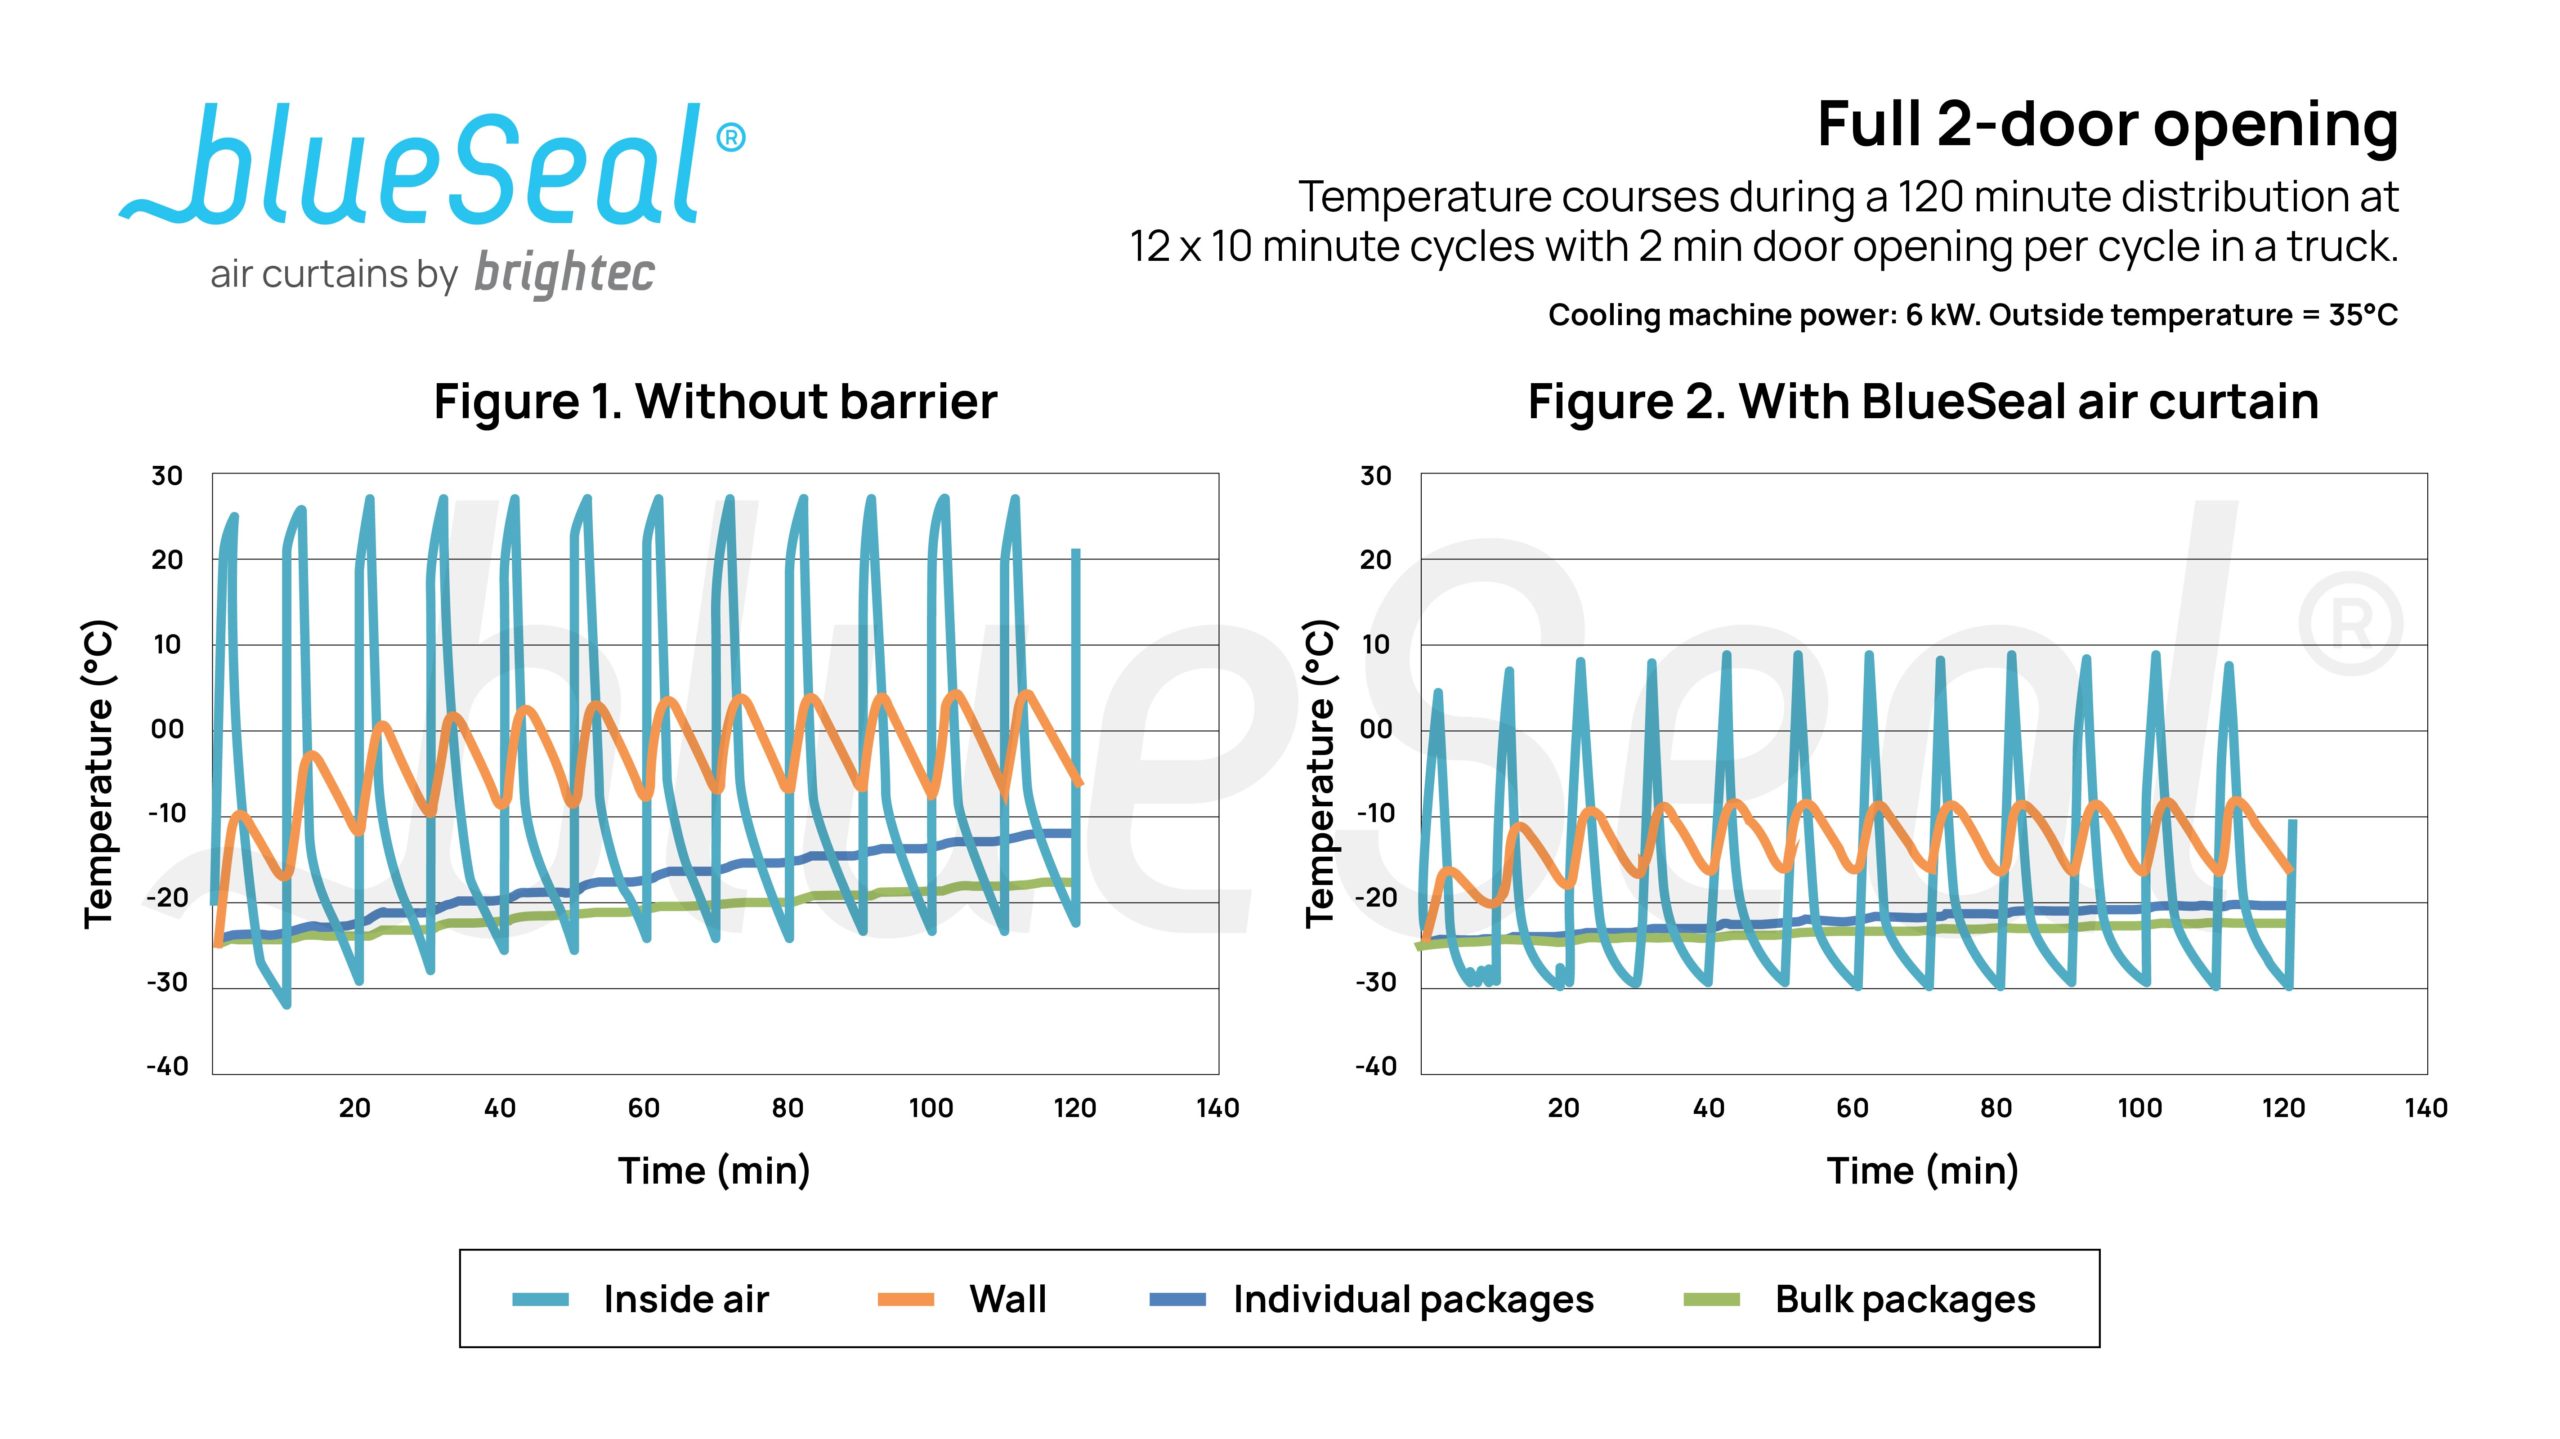
Figures 1 and 2 show the temperature-time courses (T-courses) during a 12 x 10 minute cycle with a 2 minute door opening every cycle for trucks without a climate barrier and with BlueSeal air curtains equipped.
Without climate barrier : Inside air temperature increases rapidly even with 9,900kg of bulk ice in the cargo space – within 2 minutes this increases by 24°C. The temperature of the ice cream package (Tpackage) exceeds the minimum required temperature of -18°C after 7 door openings (shown on the dark blue curve). After 2 hours of distribution, the Tpackage increases up to -12°C and Tbulk up to -18°C (figure 1). After 6 hours of distributions (36 x 2 minute door openings) the bulk and package ice cream temperatures increase up to -10°C and -3°C respectively. This tells us that the vehicle is unsuitable to transport ice cream in these conditions without compromising the integrity of the product.
With BlueSeal air curtain : Indoor air temperature increases up to 6°C after one door opening and up to 9°C after 12 door openings (figure 2). The wall temperature remains below -7°C (compared to 5°C on the model without a climate barrier). After 6 hours of distribution, Tpackage increases up to -16°C and Tbulk rises to -20°C (table 1).
Half (1-door) opening
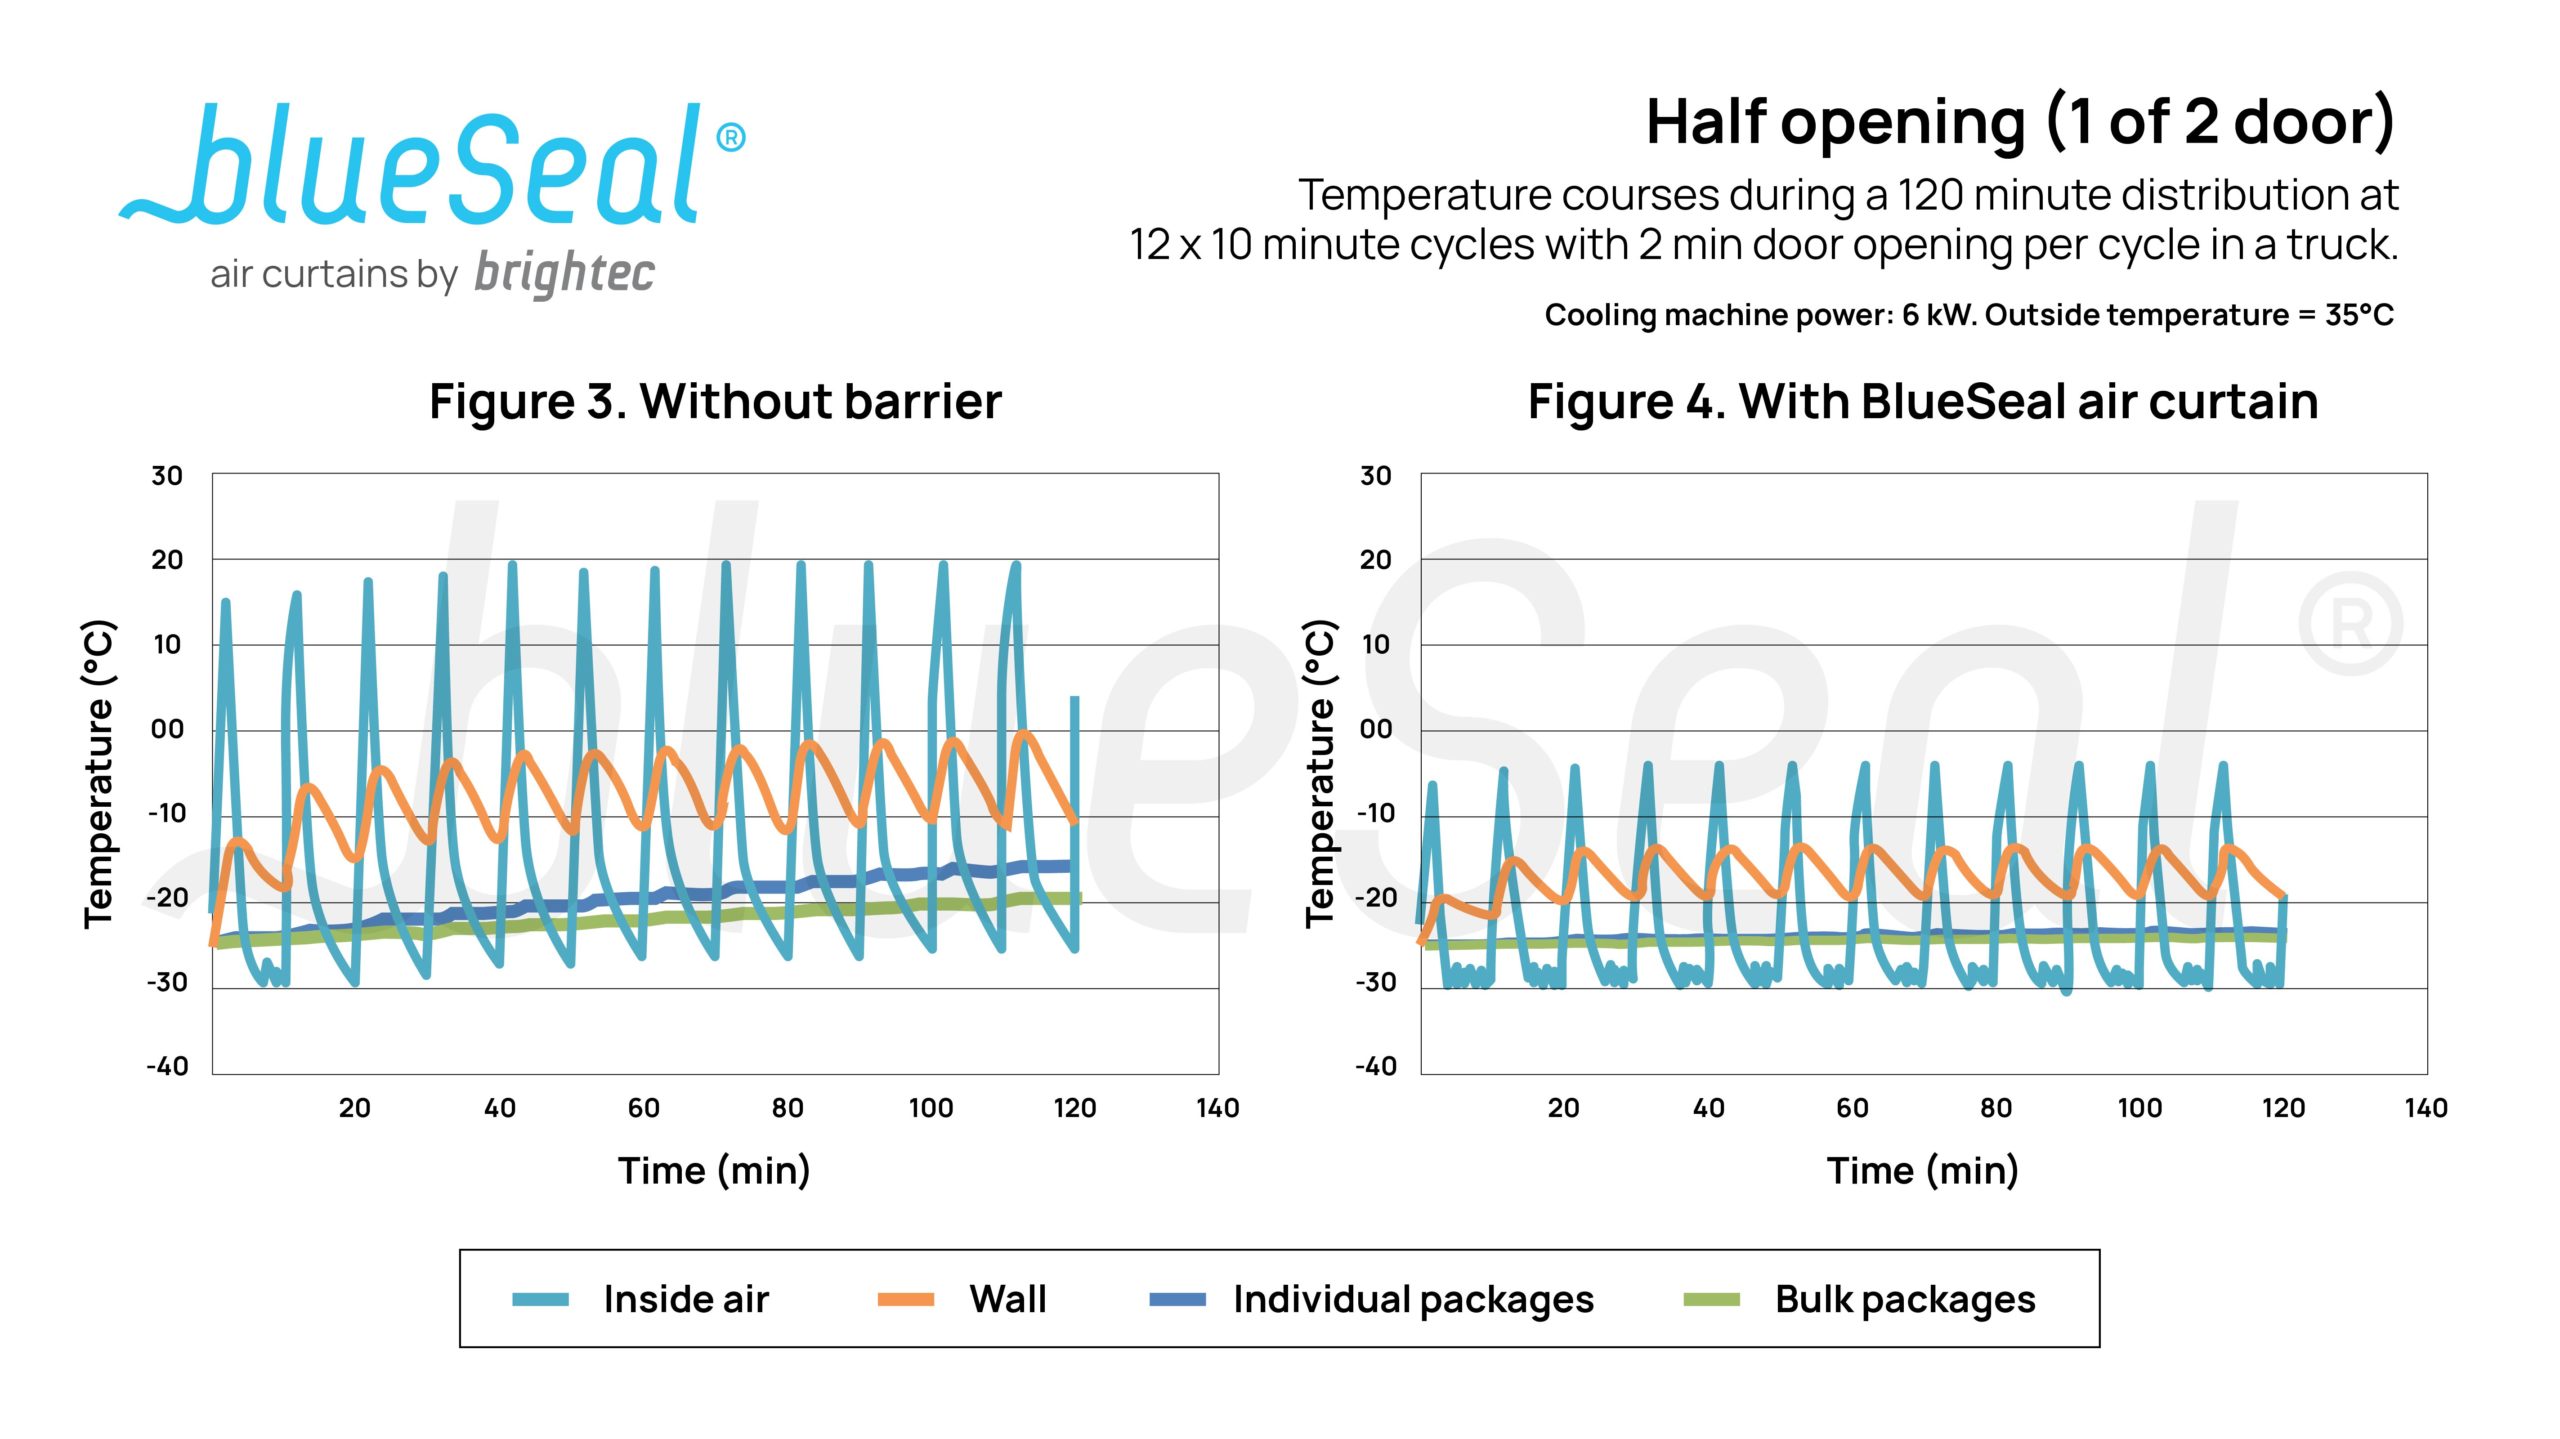
Figures 3 and 4 show the T-courses for a half-opening of the first two hours of the 6 hour distribution run.
Without climate barrier : Inside air temperature increases up to 20°C. The temperature of the ice cream package (Tpackage) exceeds the minimum required temperature of -18°C after 12 door openings (shown on the dark blue curve). After 2 hours of distribution, the Tpackage increases up to -16°C and Tbulk up to -20°C (figure 3). After 6 hours of distribution (36 x 2 minute door openings), product temperature rises up to -9°C and -14°C. Air temperature increases from -25°C up to 20°C.
With BlueSeal air curtain : A markedly better performance with an air temperature rise of up to -2°C (compared to 20°C without a barrier). Wall temperature increases to -14°C (compared to -2°C without). During the first 2 hours of the distribution run ice cream temperatures in both individual and bulk packaging remain far below the desired -18°C (figure 4). This remains consistent throughout the 6 hour distribution run, with the temperature of both at -23°C at the end of the experiment (table 1). Figure 4 shows that the air temperature will fluctuate above -30°C. During this test the cooling machine frequently meets its set point and will switch on/off to meet the demand for cooling.
One-third door opening (single door) at rear 3-doors

Figures 5 and 6 show the predicted T-courses at a one-third opening at rear 3-doors without and with BlueSeal.
Without climate barrier : From figure 5, we can see that both Tbulk and Tpackage remain below the desired -18°C. At the end of the 6 hour distribution run (36 x 2 min. door opening) the bulk ice increases up to -18°C and the single packages up to -14oC which is 4°C higher than the desired -18oC (table 1).
With BlueSeal air curtain : We can clearly see that the door opening format combined with BlueSeal offers a significant improvement over the other configurations (see figure 6). After 6 hours of distribution (36 x 2 minute door openings) the individually packaged ice cream remains far below -18°C, at -25°C (table 1).
Conclusions
We can deduce that BlueSeal is greatly advantageous in maintaining the cold chain and keeping product integrity intact in all door opening scenarios. The optimal format for this is using a one-third door opening configuration but this also performs excellently when opening only one of the two rear doors of the vehicles cargo space.
The results of the individual ice cream packages that are more susceptible to temperature increase gives us confidence of BlueSeal’s performance even during frequent door openings used in the test. As these temperatures barely increased this gives us confidence that the combination of BlueSeal with a half-opening of 2 door and one-third door opening would be favourable even under less forgiving door opening regimes.
We performed these simulations using a 6kW cooling machine. Using a higher cooling power would help to maintain temperatures at a lower level at the trade-off of a higher energy use.
For the above mentioned regimes of distribution drives, with 2 minute door openings, we conclude that without use of an effective climate barrier:
1. Inside air temperature increases up to 14°C (one third door opening), 20°C (half door opening) and 27°C (full door opening).
2. Individually packed ice cream temperatures (Tpackage) cannot be kept to a sufficiently low temperature during a 6 hour distribution run, all far exceed the required temperature set by ATP guidelines.
3. Bulk ice cream temperature (Tbulk) is not kept to the desired level in half or full door openings with increases up to -14°C and -10°C respectively. This only becomes possible using a one-third door opening configuration.
Using BlueSeal air curtains:
1. Inside air temperatures are kept much lower at -8°C (one third door opening), -2°C (half door opening) and 10°C (full door opening) – see table 1.
2. Individually packaged ice cream temperature (Tpackage) remains at low temperatures of -25°C, -23°C and -16°C (full door opening). Only when doors are fully open does the Tpackage exceed the critical temperature of -18°C during the 6 hour distribution.
Our next article will explore outcomes based on different cooling machine capacities and their effect on temperature courses and energy use.